🚇 Dr Sulaiman Al Habib Metro Station - Spatial Analysis Report
🗺️ Interactive Origin Map
The map below shows the origin locations of all survey respondents, color-coded by their transport mode to reach the metro station, overlaid on the complete Riyadh Metro network. The metro lines are shown in their official colors with all stations marked. Dr Sulaiman Al Habib station (survey location) is highlighted with a red star. Click on markers for detailed information. Use the layer control in the top-right to toggle layers and filter by transport mode or hide/show the metro network.
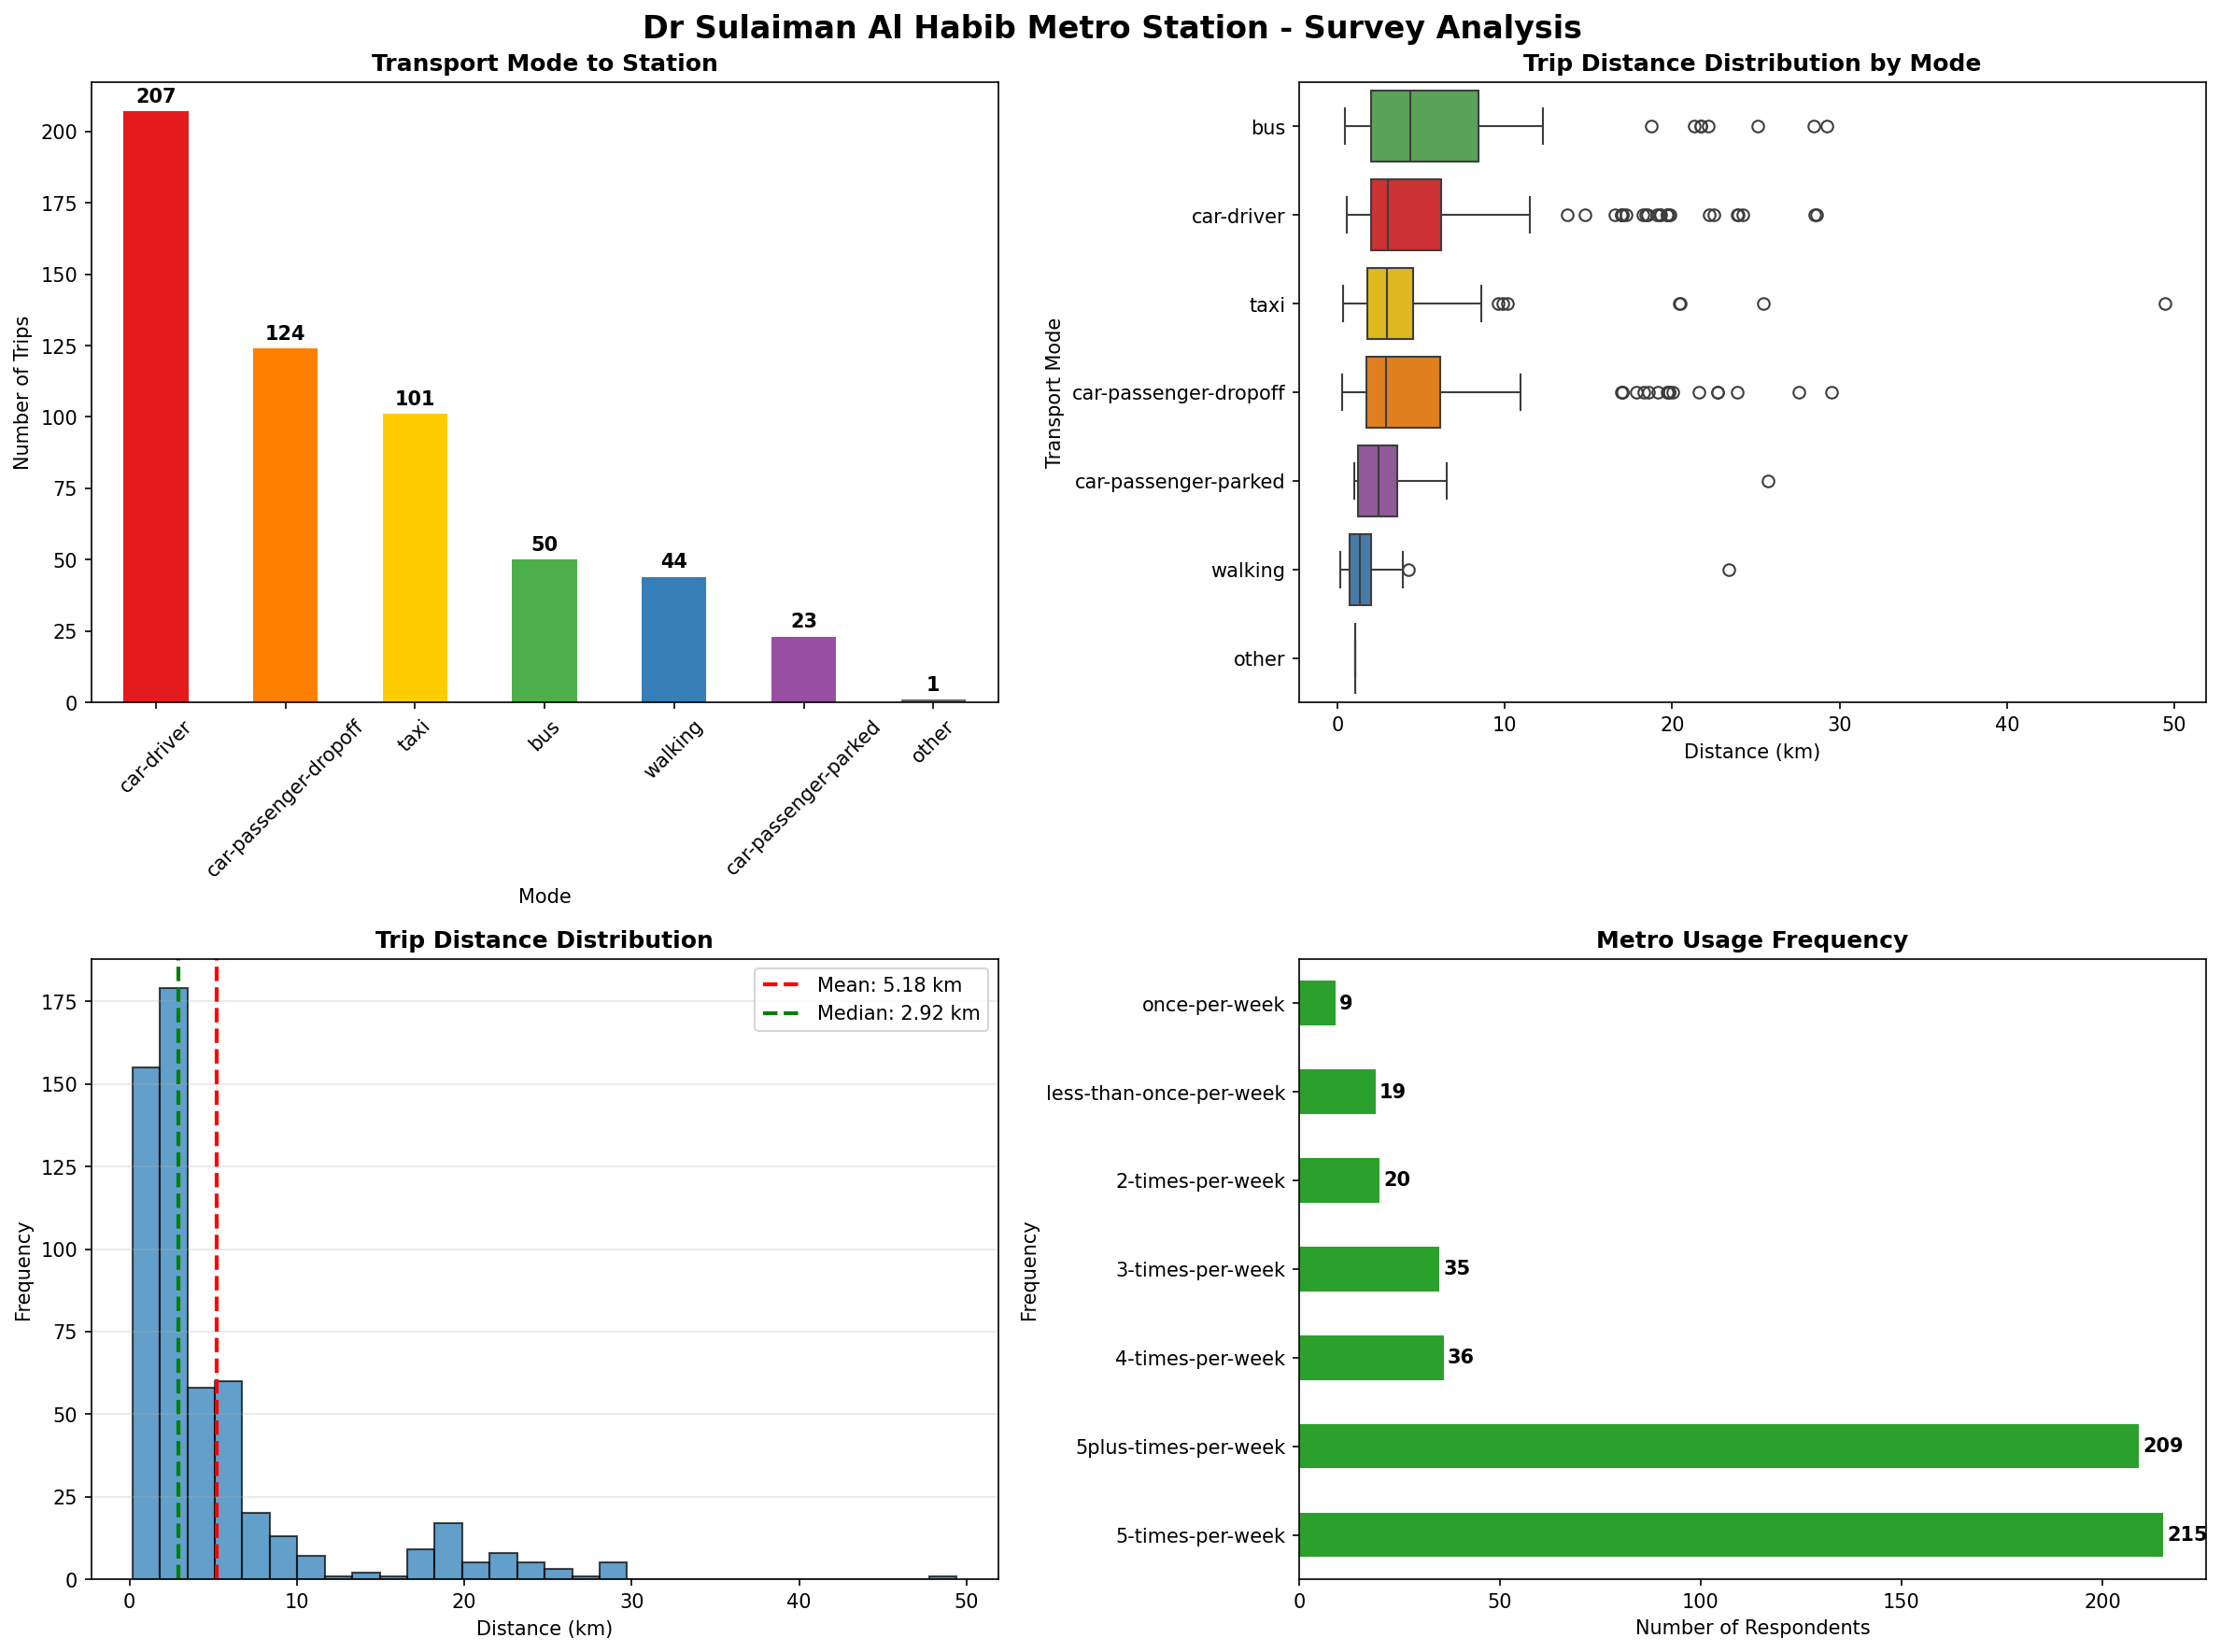
📊 Mode and Distance Analysis
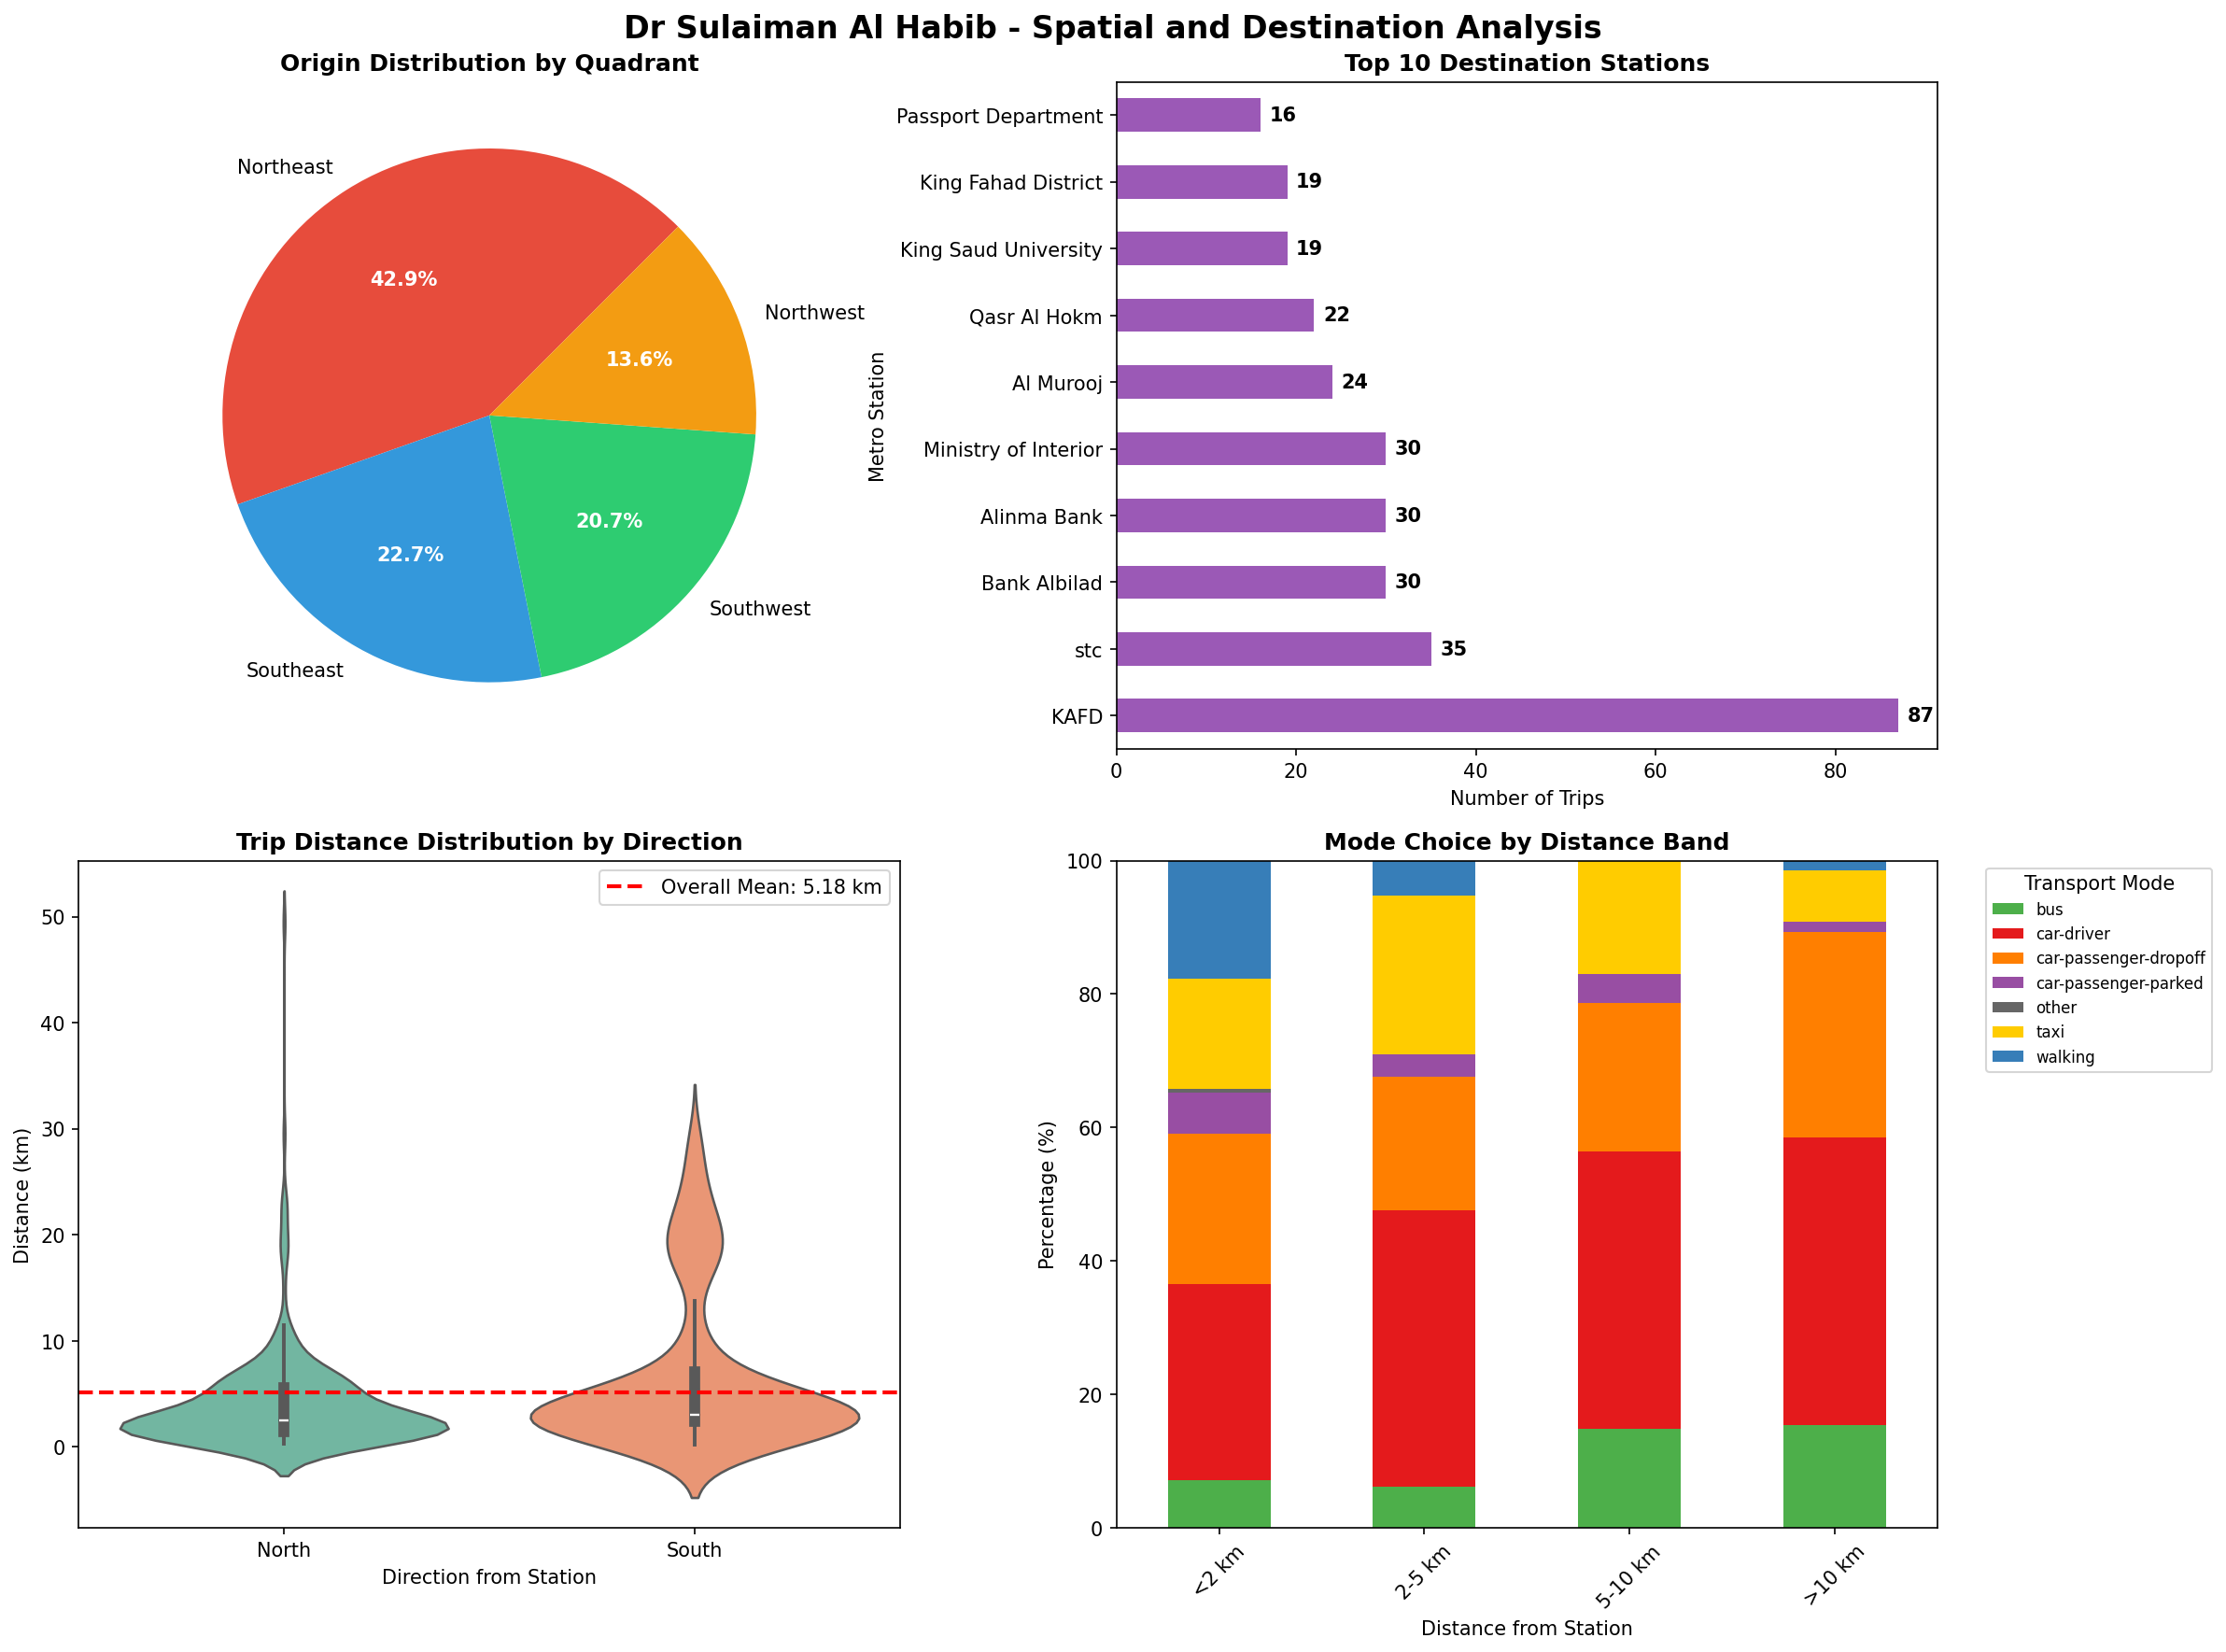
🌍 Spatial and Destination Analysis
📋 Comprehensive Analysis Summary
🚗 Westward Origin Analysis
Analysis of passengers originating from areas west of Dr Sulaiman Al Habib station:
- 189 respondents (34.4%) travel from west of the station
- Of these, 76 are car drivers (40.2%) of westward trips
- These westward car drivers travel an average of 4.15 km
📍 Spatial Distribution Patterns
Origins are distributed across all quadrants around the station:
- Southwest: 114 trips (20.7%)
- Northwest: 75 trips (13.6%)
- Southeast: 125 trips (22.7%)
- Northeast: 236 trips (42.9%)
🎯 Top Destinations
The most popular destination stations indicate travel patterns and potential employment/activity centers:
- KAFD: 87 trips (15.8%)
- stc: 35 trips (6.4%)
- Bank Albilad: 30 trips (5.5%)
- Alinma Bank: 30 trips (5.5%)
- Ministry of Interior: 30 trips (5.5%)
🚌 Mode Choice Insights
- Dominant Mode: car-driver is the most common mode (207 trips, 37.6%)
- Walking Catchment: 44 trips (8.0%) walk to the station
- Public Transport: 50 trips (9.1%) use buses
📊 Mode Statistics
| Transport Mode | Count | Avg Distance (km) | Median Distance (km) | Std Dev (km) |
|---|---|---|---|---|
| bus | 50 | 7.50 | 4.38 | 7.73 |
| car-driver | 207 | 5.53 | 3.00 | 5.88 |
| car-passenger-dropoff | 124 | 5.77 | 2.92 | 6.62 |
| car-passenger-parked | 23 | 3.72 | 2.43 | 5.12 |
| other | 1 | 1.05 | 1.05 | nan |
| taxi | 101 | 4.37 | 2.94 | 5.92 |
| walking | 44 | 1.96 | 1.34 | 3.44 |
🔍 Key Findings
- Dominant Mode: car-driver is the most common mode (207 trips, 37.6%)
- Average Access Distance: 5.18 km with a standard deviation of 6.18 km
- Geographic Catchment: Origins span from 0.17 km to 49.42 km
- Station Line: Blue Line