🚇 King Fahad Sports City Metro Station - Spatial Analysis Report
🗺️ Interactive Origin Map
The map below shows the origin locations of all survey respondents, color-coded by their transport mode to reach the metro station, overlaid on the complete Riyadh Metro network. The metro lines are shown in their official colors with all stations marked. King Fahad Sports City station (survey location) is highlighted with a red star. Click on markers for detailed information. Use the layer control in the top-right to toggle layers and filter by transport mode or hide/show the metro network.
📊 Mode and Distance Analysis
🌍 Spatial and Destination Analysis
📋 Comprehensive Analysis Summary
🚗 The Westward Origin Phenomenon
One of the most striking findings from this survey is the significant number of passengers originating from areas west of King Fahad Sports City station:
- 124 respondents (41.2%) travel from west of the station
- Of these, 90 are car drivers (72.6%) of westward trips
- These westward car drivers travel an average of 8.15 km
Why is this significant? When overlaying the metro network on the map, it becomes clear that these passengers are driving past multiple existing metro stations on the Blue Line (Line 1), Orange Line (Line 3), and Purple Line (Line 6) to reach King Fahad Sports City.
Possible Explanations:
- Terminal Station Advantage: As the eastern terminal of the Red Line, passengers are guaranteed seats and avoid the need to transfer or backtrack
- Superior Parking Facilities: Terminal stations typically offer more extensive Park & Ride facilities with better availability and pricing
- Service Quality Gaps: May indicate inadequate parking, access, or service quality at intermediate western stations
- Direct Route Preference: The Red Line may offer more direct routes to popular destinations compared to other lines requiring transfers
- Cultural/Behavioral Factors: Preference for starting journeys at the beginning of a line for perceived reliability and comfort
📍 Spatial Distribution Patterns
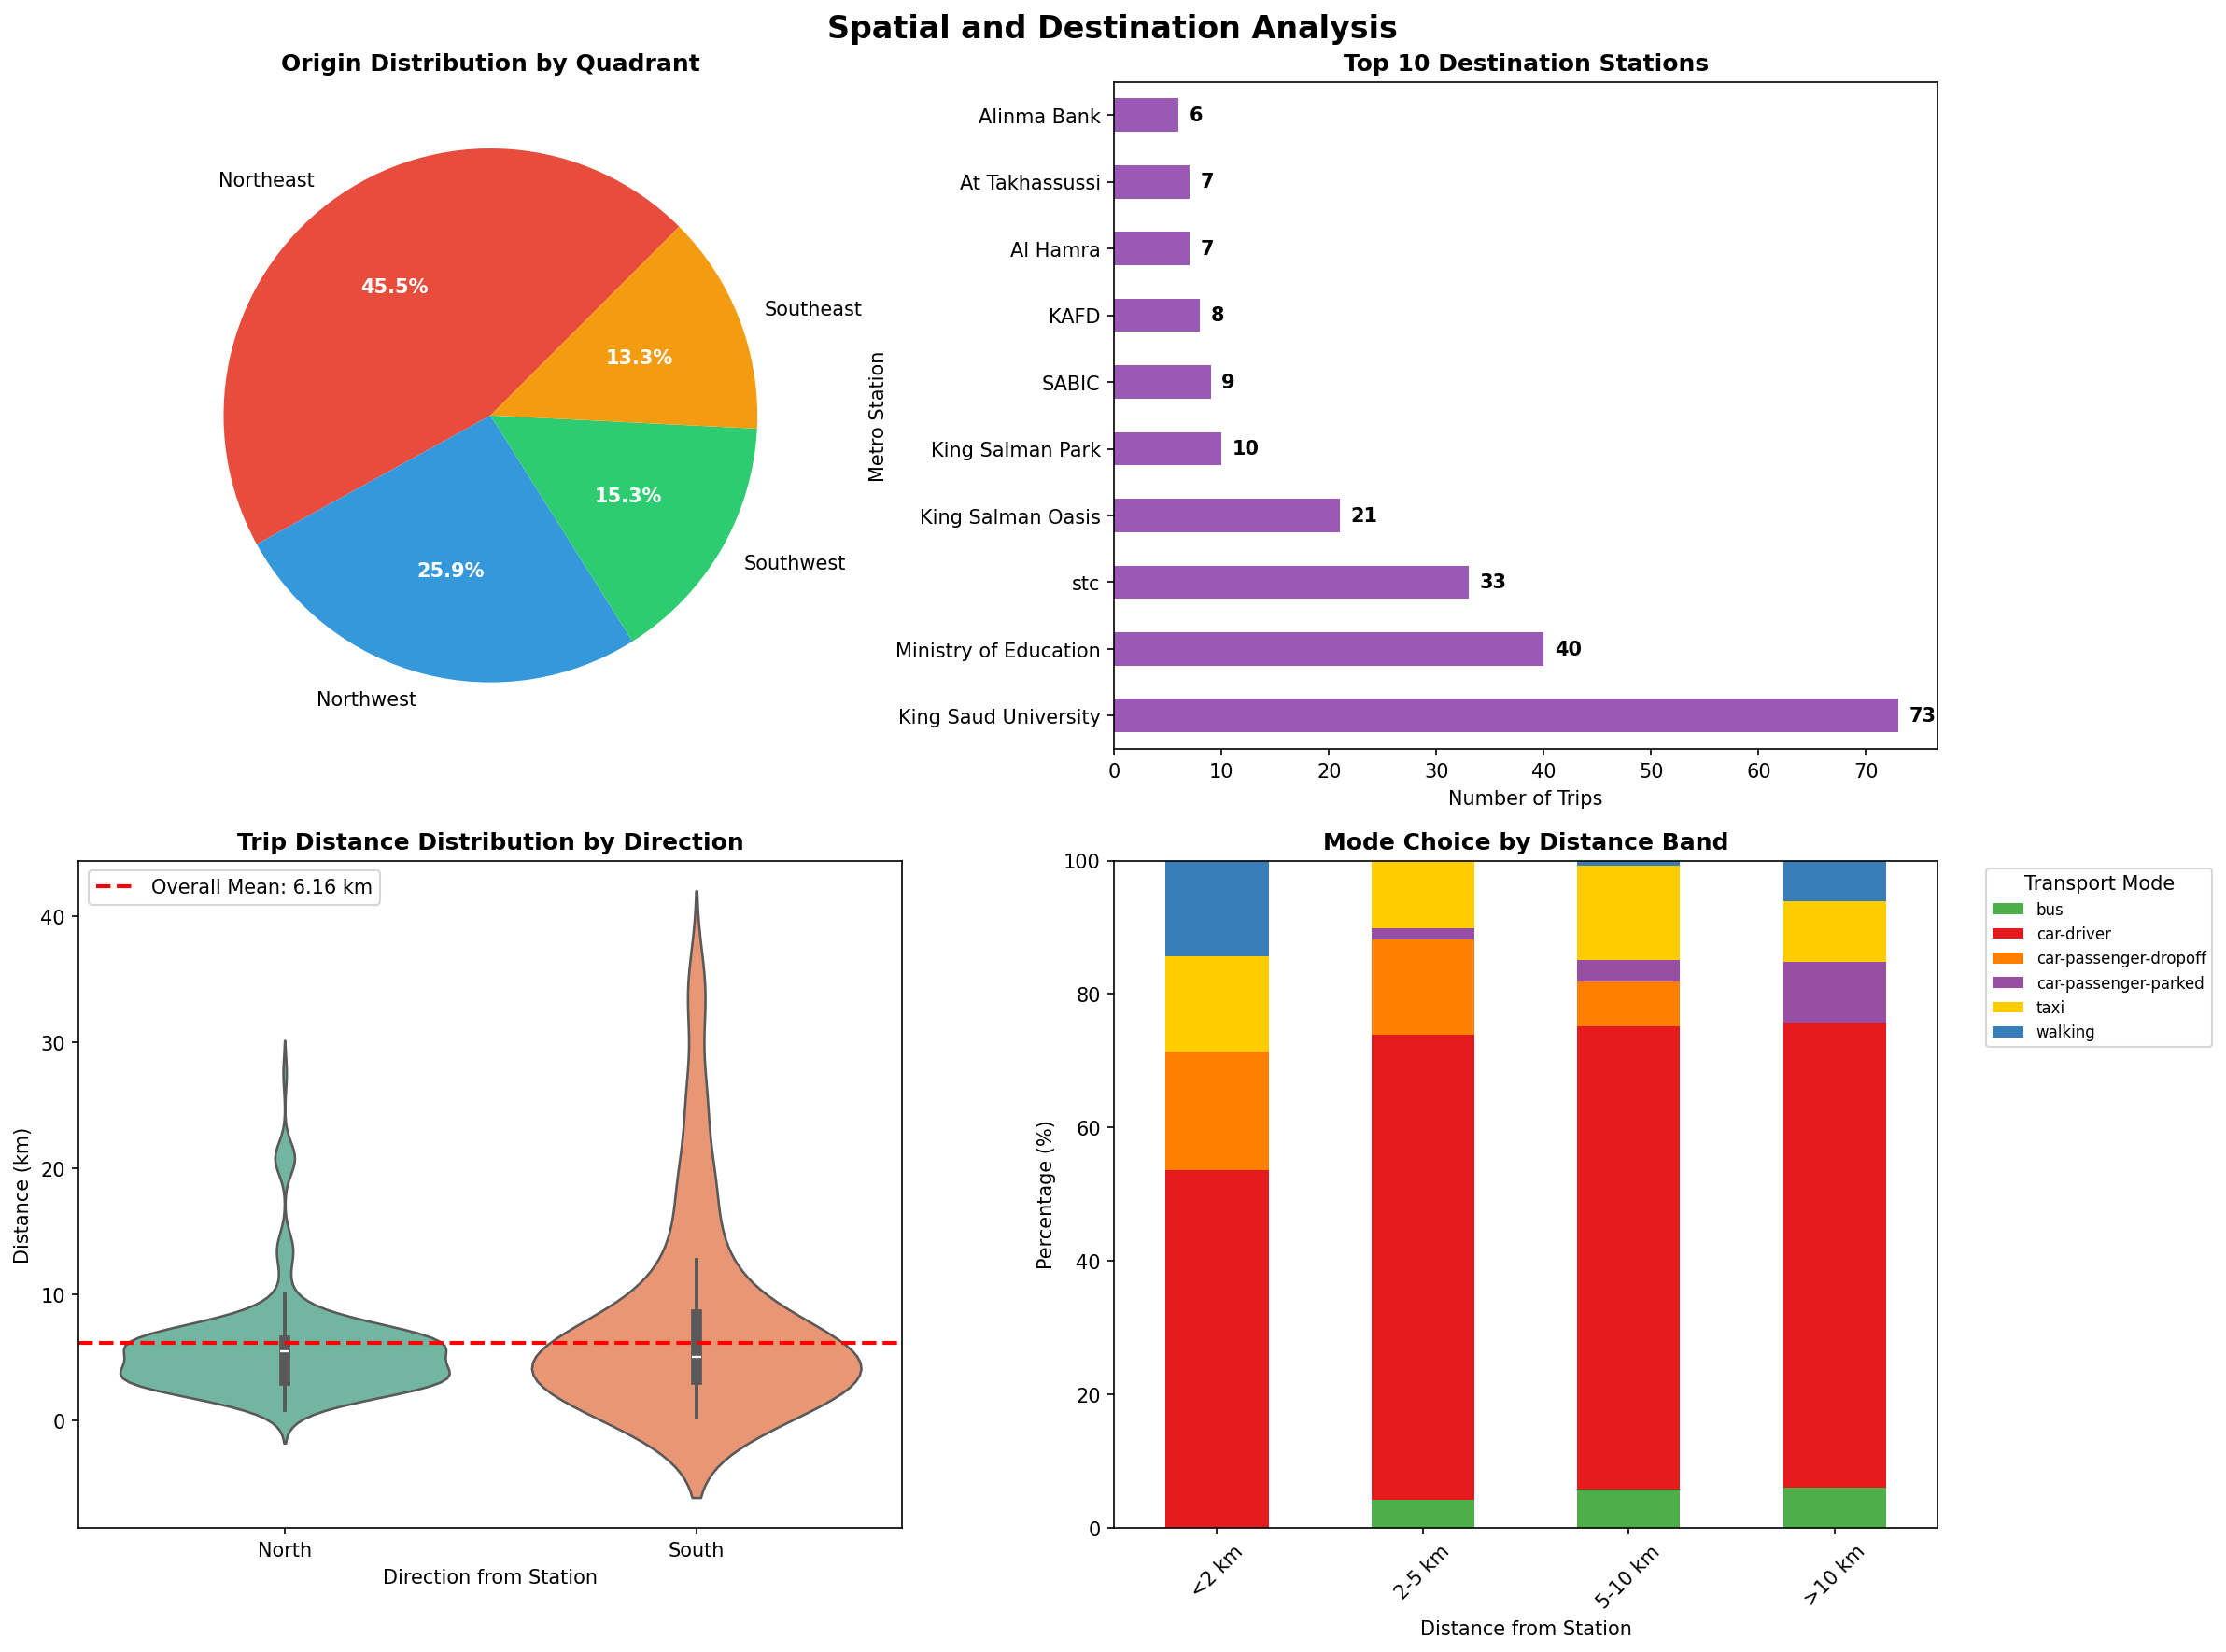
Origins are distributed across all quadrants around the station:
- Southwest: 46 trips (15.3%) - Largest catchment area
- Northwest: 78 trips (25.9%)
- Southeast: 40 trips (13.3%)
- Northeast: 137 trips (45.5%)
The dominance of southwestern origins suggests that the station serves a large residential/mixed-use area to the southwest.
🎯 Top Destinations
The most popular destination stations indicate travel patterns and potential employment/activity centers:
- King Saud University: 73 trips (24.3%)
- Ministry of Education: 40 trips (13.3%)
- stc: 33 trips (11.0%)
- King Salman Oasis: 21 trips (7.0%)
- King Salman Park: 10 trips (3.3%)
These destinations reveal commute patterns toward central business districts, government centers, and key transit hubs along the Red Line.
🚌 Mode Choice Insights
- Car Dependency: 68.1% of all trips use private cars (driver or passenger), indicating high car dependency for metro access
- Walking Catchment: Only 7 trips (2.3%) walk to the station, with average distance of 7.43 km
- Public Transport: Only 14 trips (4.7%) use buses, suggesting limited feeder bus services
- Distance-Mode Relationship: car-passenger-parked users travel the longest average distance (10.82 km), indicating this mode serves wider catchment areas
💡 Strategic Recommendations
- Enhance Western Station Access: Investigate and improve parking, access, and service quality at intermediate stations on Lines 1, 3, and 6 to reduce bypass behavior
- Expand Park & Ride Capacity: Given the dominance of car-based access (68.1% car-driver alone), expand parking facilities, especially for westward catchment areas
- Improve Feeder Services: Develop dedicated feeder bus routes to serve the southwestern catchment area and reduce car dependency
- Pedestrian Access Enhancement: The limited walking trips suggest opportunities to improve pedestrian infrastructure and mixed-use development near the station
- Monitor Terminal Station Effects: Study whether similar bypass patterns exist at other terminal stations to inform system-wide policy
- Dynamic Pricing/Incentives: Consider implementing parking pricing or incentives to better distribute demand across the network
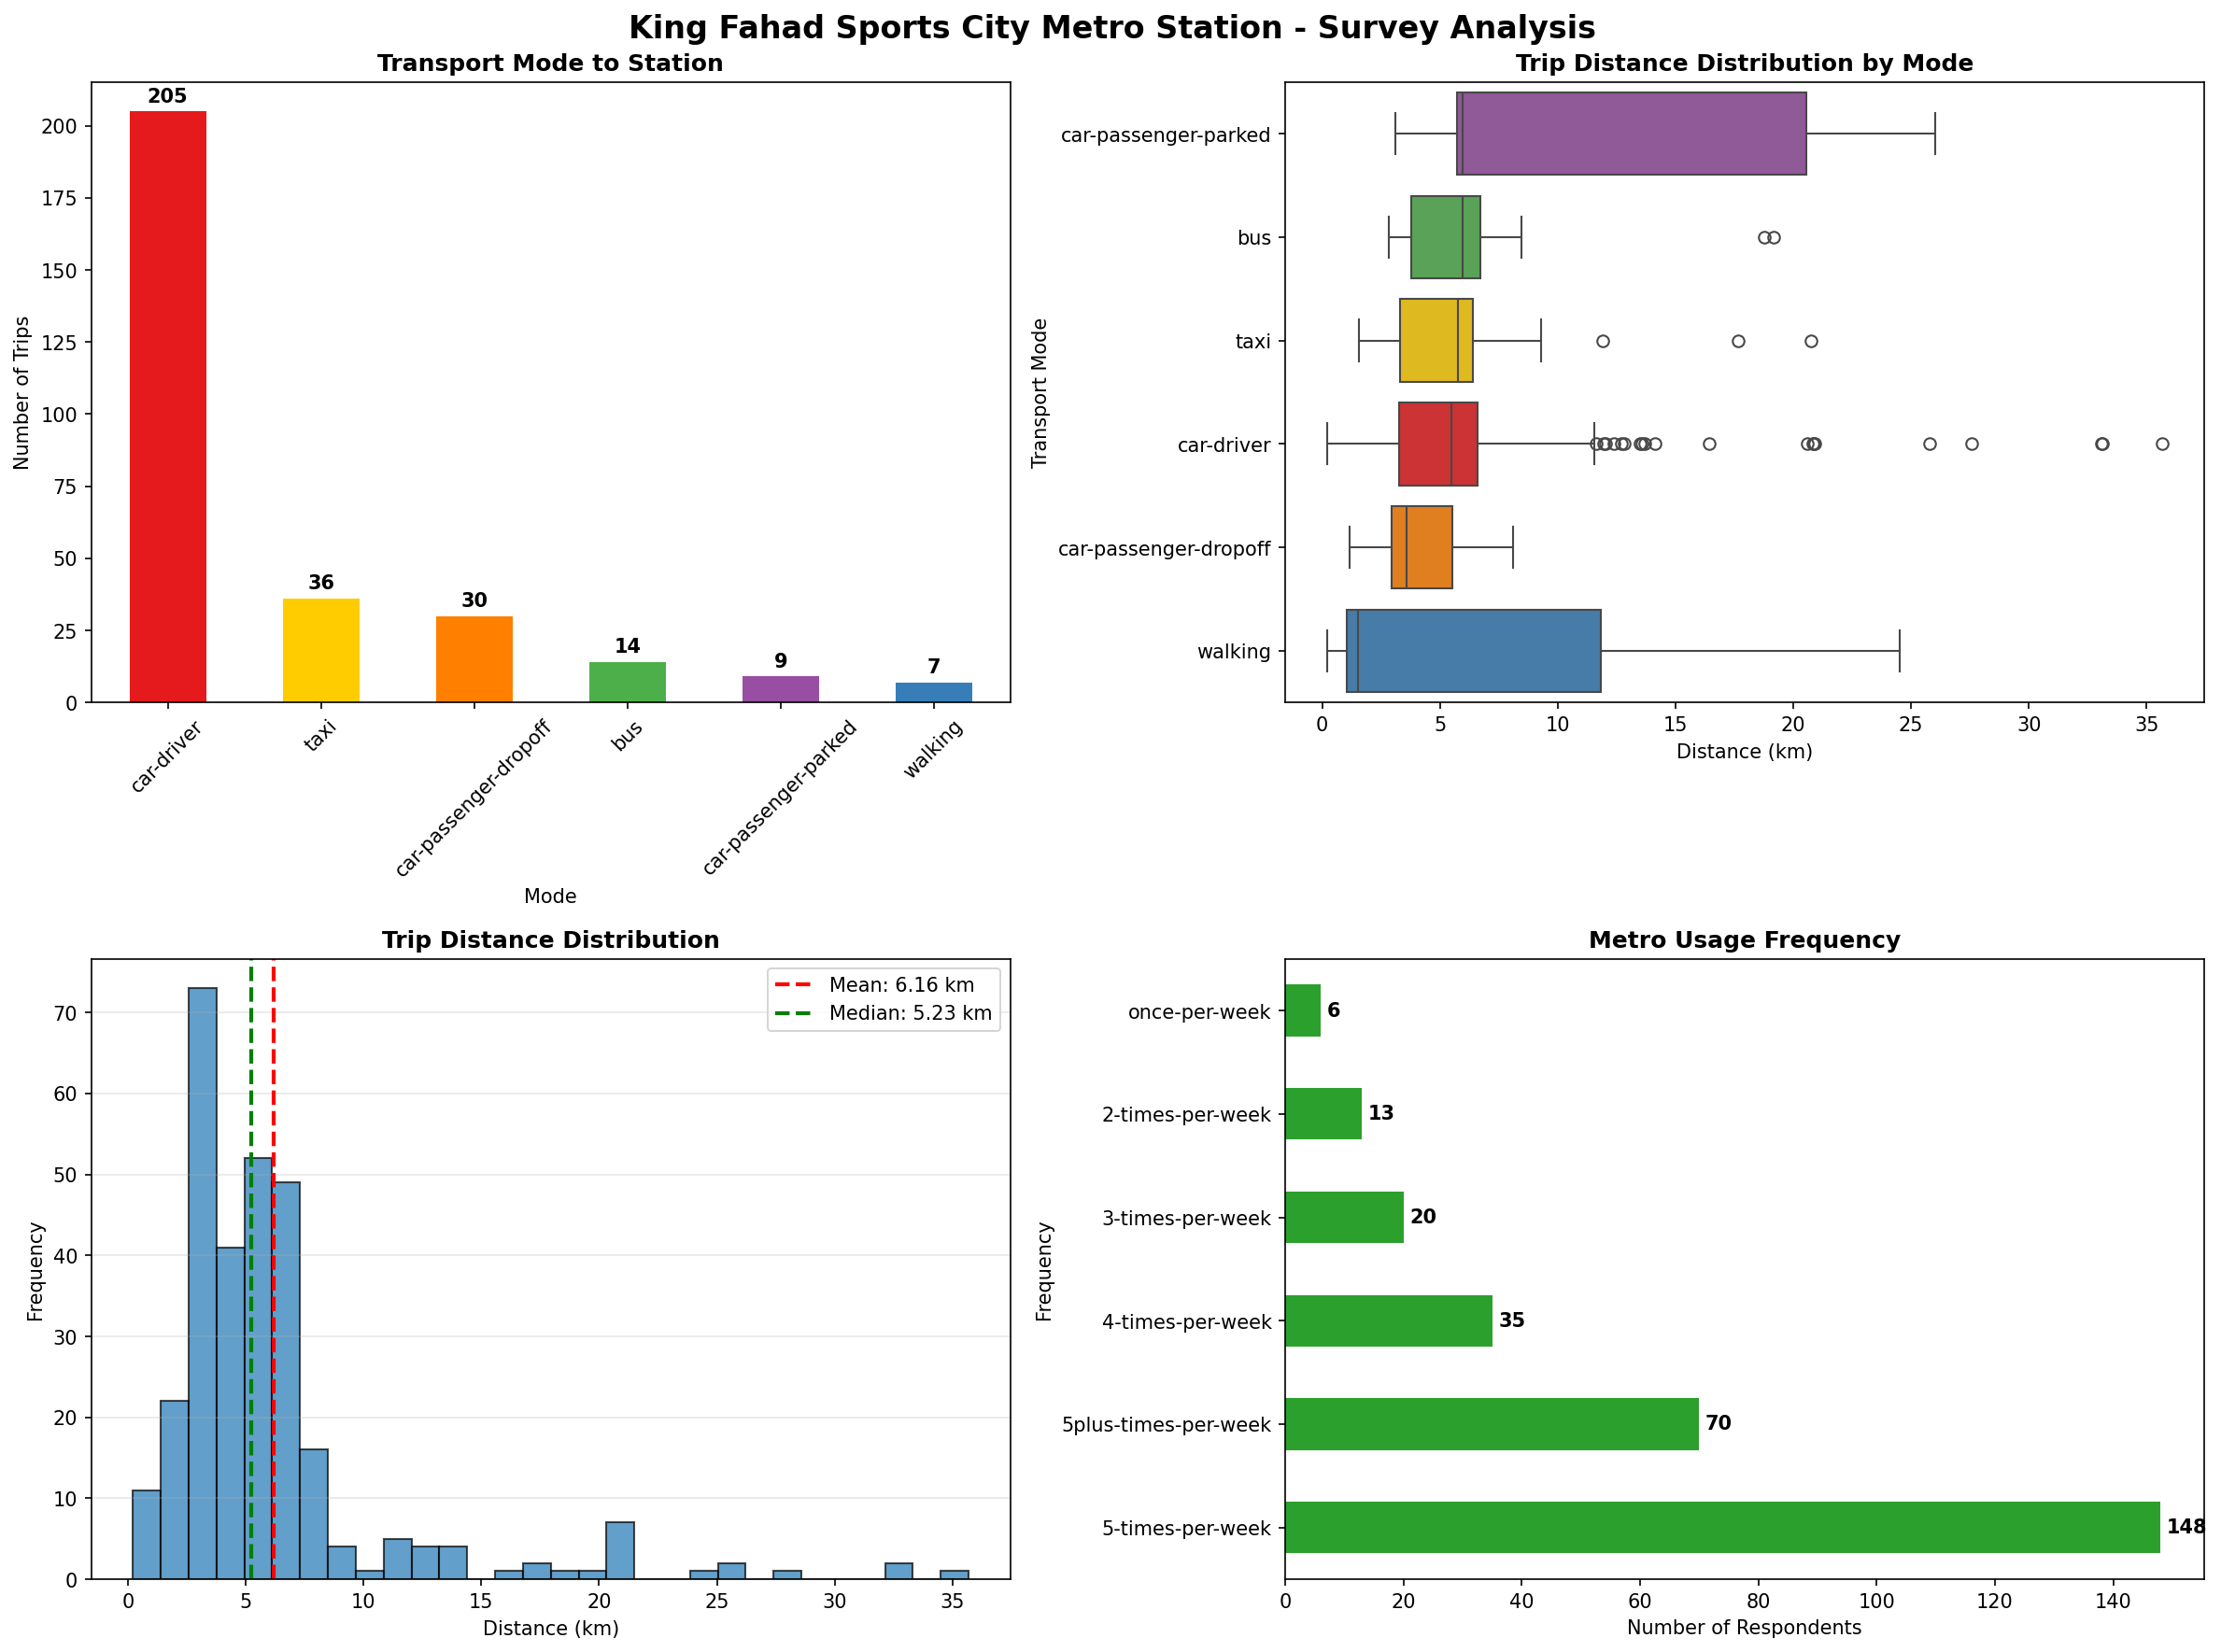
📊 Mode Statistics
🔍 Key Findings
- Dominant Mode: Car-driver is the most common mode (205 trips, 68.1%)
- Average Access Distance: 6.16 km with a standard deviation of 5.26 km
- Geographic Catchment: Origins span from 0.21 km to 35.69 km
- Mode-Distance Relationship: car-passenger-parked users travel the longest average distance (10.82 km)
- Walking Catchment: 7 walking trips with average distance of 7.43 km
- ⚠️ Westward Origins Pattern: 124 respondents (41.2%) travel from west of the station, with 90 car drivers (72.6% of westward trips). This suggests passengers are bypassing closer metro stations on Lines 1, 3, and 6 to board at King Fahad Sports City, which is the eastern terminal of the Red Line. This may indicate preferences for starting at a terminal station (guaranteed seats, better parking facilities) or gaps in the western network coverage.